How inflation data and Fed decisions move crypto
On this page
Crypto trades around the clock, but some of its biggest daily moves happen at the same scheduled times as stock and currency markets. Those times usually line up with US economic data and central bank decisions. Knowing the calendar helps you avoid being surprised.
The two events that matter most
- Inflation data (CPI). The US Bureau of Labor Statistics publishes the Consumer Price Index once a month, at 8:30 a.m. Eastern Time. It shows how fast prices are rising.
- Interest-rate decisions (FOMC). The Federal Reserve's rate-setting committee holds eight scheduled meetings a year. Its statement is released at 2:00 p.m. Eastern Time, followed by a press conference.
Jobs reports, central bank decisions in Europe, the UK and Japan, and GDP figures can move markets too, but these two get the most attention.
Why US data moves Bitcoin
Higher-than-expected inflation can mean interest rates stay higher for longer. Higher rates make cash and bonds more attractive, tend to strengthen the US dollar and reduce appetite for riskier assets. Crypto is usually treated as one of those riskier assets, so it often reacts in the same direction as tech stocks.
What moves prices is the surprise, not the number itself. Markets price in what economists expect. A figure close to the forecast may barely register; a big miss in either direction can cause a sharp move within minutes.
What a release day can look like
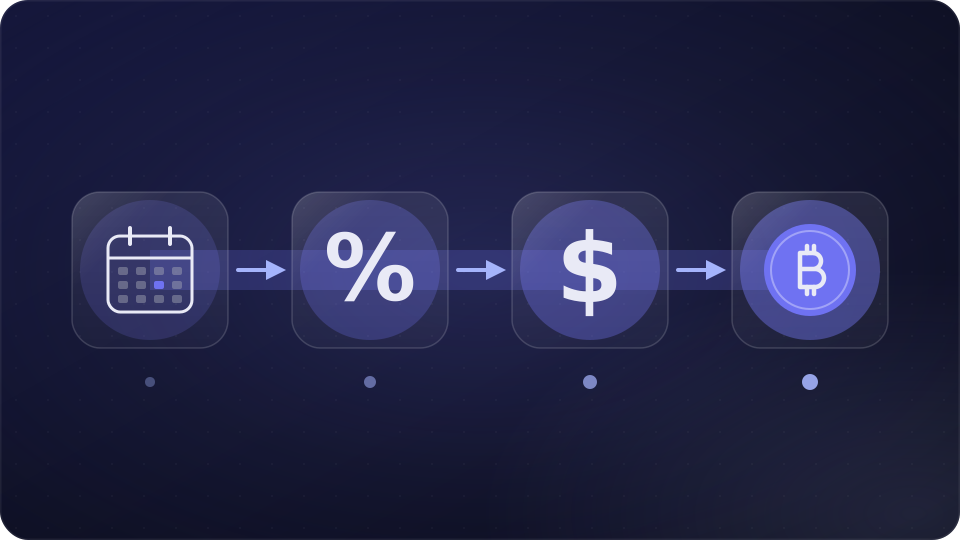
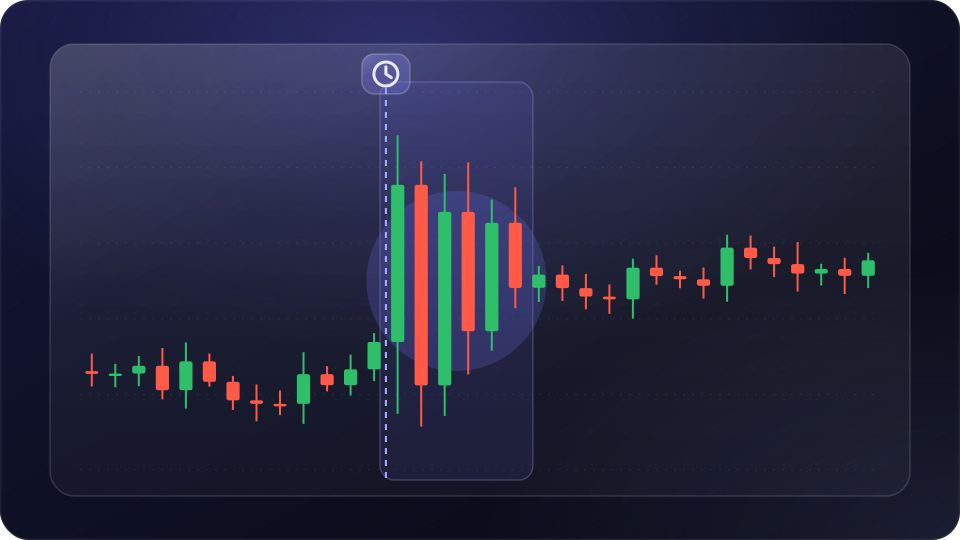
Volatility often drops in the hours before a major release, as traders wait. Right after the number comes out, prices can swing both ways before picking a direction. Spreads widen, liquidations on leveraged positions can add fuel, and the first move is sometimes reversed within the hour.
Practical habits
- Check the economic calendar at the start of each week and note the release times in your own time zone.
- Avoid opening new leveraged positions in the minutes before a major release.
- If you invest for the long term, a release-day swing is noise; there is no need to react to it.
Reading the forecast column
Most economic calendars show three numbers for each release: the previous figure, the forecast (also called the consensus) and the actual result once it is published. The gap between the forecast and the actual figure is the surprise that moves prices, so the forecast column is the one to look at before the release.
Remember that one report rarely changes the bigger picture on its own. Central banks look at many months of data, and markets often wait for the next release to confirm a trend. A single hot or cool reading can produce a sharp move that fades within days.
For education only, not financial advice. Crypto assets are volatile and you can lose money.
Get one like this every morning
A 5-minute briefing in your inbox each weekday. Free, unsubscribe anytime.
Or follow the Telegram channel @pakaoqpMarket now
Latest news